Analyzing water distribution data of Faridabad Smart City
When data from 95 RTU panels are collated at the central SCADA , the in-premise server, with each site having about 50 to 100 assets, which include pressure switches on each pump motor, inward and outward water flow meters, level monitoring of water sump tanks , and energy data of each site, which includes current,voltage , and power .
Each site is refreshing its asst status every 10 minutes throughout 24X7X365.
Authorities want to monitor how the water is distributed around the city in 95 sites. The filtrations of data at various levels are created to drill down on why the water supply is reduced, or is as per the last few weeks’ average, etc.

Ingesting 4000 rows of data every 10 min through out the 24 X 7 X 365
The FSCL Analytics project is a large-scale data analytics platform designed to support smart city infrastructure with a primary focus on water distribution monitoring and analysis. In modern urban planning, intelligent water management systems are crucial to ensuring sustainability, efficiency, and equitable distribution of resources. These systems, powered by automation technologies like PLC (Programmable Logic Controller), SCADA (Supervisory Control and Data Acquisition), and IoT-enabled sensors, generate massive volumes of data continuously. However, collecting this data is only the beginning; the real value lies in how this data is processed, analyzed, and interpreted for actionable decision-making.
In this specific implementation, FSCL Analytics serves as a centralized analytics solution to collect, store, and visualize data from more than 90 water distribution sites. These sites feed in time-series data at intervals of 5 to 30 minutes from thousands of sensors measuring water flow, pipeline pressure, motor status, and energy consumption. Over a month, this results in over 3.45 crore rows of data, and within a five-year operational window, the platform is expected to handle more than 330 crore rows.
The overarching goal of the FSCL Analytics platform is to provide city authorities, municipal corporations, and operational managers with a reliable and insightful system to monitor resource usage, detect inefficiencies, and support long-term planning and optimization efforts. The project combines real-time monitoring with historical data analytics, offering site-wise, month-wise, and year-wise comparative insights into water usage trends.
Urban water management is one of the most critical challenges faced by municipal bodies today, especially in densely populated cities. As cities grow, so does the complexity of their water infrastructure. While deploying PLCs and SCADA systems across the water network helps automate the operations, they also generate vast volumes of telemetry and control data that can be overwhelming without the proper data processing infrastructure.
The problem faced in FSCL’s scenario is two-fold:
- Data Accumulation and Storage:
- The system gathers over 11.4 lakh rows of data per day.
- This translates to approximately 3.45 crore rows per month and over 200 crore rows in five years.
- Managing, storing, and securing this volume of time-series data requires high-performance hardware and scalable storage solutions.
- Real-time and Historical Analysis:
- Authorities require a month-wise comparison of water flow, energy consumption, and pump utilization to identify usage patterns, seasonal trends, and anomalies.
- Performing even simple queries on recent data can take up to 20 minutes, even with a professional-grade server setup (40-core CPU, 128 GB RAM, SATA HDD with 12 GBPS bandwidth).
- This sluggish performance hinders the ability to make timely decisions, especially in scenarios that require quick responses, such as leak detection, abnormal consumption spikes, or pump failure alerts.
Thus, the challenge is not merely about capturing data, but about making it usable and accessible at scale—a classic problem in data engineering and analytics.
The FSCL Analytics project is built around the real-world scenario of managing a city’s water distribution system through automation and intelligent data analytics. Here’s a deeper breakdown of how the system is designed and what it encompasses:
- Categorization of Sites
The 90+ water distribution sites in the city are classified into the following four categories based on their function in the water supply chain:
Category | Description |
Renny wells | Primary sources where raw water is received and stored before distribution. |
Main Boosting Stations (MBS) | Major hubs are responsible for pumping water to large city zones. |
Intermediate Boosting Stations (IBS) | Mid-level stations that receive water from MBS and distribute it to other locations. |
Sub-Boosting Stations (SBS) | Smaller, localized stations ensure water pressure and delivery at the final mile. |
This classification helps streamline data monitoring, maintenance scheduling, and performance analysis specific to each level in the distribution hierarchy.
- Site-Level Data Capture
Each of the 90+ sites includes:
- Inflow Monitoring: Water is channeled into underground tanks with an average storage capacity of 40 lakh liters (4 million liters). The inflow is constantly monitored using flow meters to ensure that adequate water is being received.
- Header-Based Distribution: Water is distributed via 2 to 3 pipeline headers per site. Each header has a pipe diameter of 200 to 300 mm and is fitted with flow meters to monitor output. These flow meters provide real-time data on the amount of water being delivered to different zones.
- Pressure Sensors: Pressure data is crucial for identifying blockages, leakages, or pump inefficiencies. All pressure readings are captured continuously and logged.
- Motor and Pump Monitoring: Motors connected to the storage tanks are responsible for distributing the water. Local PLCs monitor each motor’s run hours, operational cycles, and response to control signals.
- Energy Metering: Each site also includes energy meters that connect to PLCs via Modbus protocols. These meters track voltage, current, and power consumed by the pumps — valuable data for both energy efficiency tracking and predictive maintenance.
- Asset Distribution Table
The FSCL Analytics platform encompasses a wide range of field assets deployed across all water distribution sites, ensuring comprehensive monitoring and control of these assets. These assets include flowmeters for tracking water transmission, level transmitters for monitoring tank levels, and energy meters for capturing power usage data. Additionally, motors are installed to manage water pumping operations, while pressure transmitters help identify pipeline anomalies, such as leaks or blockages. This robust asset infrastructure forms the backbone of accurate data acquisition and intelligent decision-making across the system.
Asset Name | Total Count |
Flowmeter | 234 |
Pumps/Motors | 531 |
Level Transmitters (LT) | 96 |
Pressure Transmitter (PT) | 684 |
Energy Meter | 95 |
- Data Collection and Transmission
Data from each sensor and meter is collected at intervals ranging from 5 to 30 minutes.
- Over 4000+ unique data points across the city feed into the analytics system.
- Data is sent to a central server over secure protocols, where it is stored in structured databases optimized for time-series analysis.
- Data Volume
Let’s look at the data scale:
- Daily Data Rows: ~11.4 lakh (1.14 million)
- Monthly Data Rows: ~3.45 crore (34.5 million)
- Five-Year Data Rows: ~200 crore (2 billion+)
This makes FSCL Analytics one of the most data-intensive municipal monitoring platforms, rivaling the scale of many enterprise-grade IoT solutions.
- Infrastructure Challenges
Despite having a high-performance server setup:
- CPU: 40 cores
- RAM: 128 GB
- Disk Bandwidth: 12 GBPS SATA HDD
Even simple analytical queries, such as comparing water flow trends over the past month at a single site, can take up to 20 minutes. This is unacceptable for real-time decision-making and emergency responses.
The volume of data, while rich with potential insights, poses a significant computational challenge. The current hardware, although powerful, is not sufficient when data indexing, optimization, and efficient querying are not properly engineered.
The FSCL Analytics project is a compelling case study in real-world industrial data analytics at scale. It demonstrates the transition from automation to intelligent decision-making by leveraging data.
Key Takeaways:
- From Automation to Insight: Automation, facilitated by SCADA and PLCs, provides the infrastructure for data collection. FSCL Analytics takes the next step — transforming that data into actionable insights.
- Scale of Operation: Managing data from over 90 geographically distributed sites, with more than 4,000 sensor points providing real-time information, is a significant undertaking. The system’s ability to handle this scale over a multi-year period is a testament to robust engineering.
- Data Engineering Matters: The major bottleneck in the system is not just hardware, but also the lack of optimized data engineering, including indexing strategies, compression, partitioning, and potentially distributed processing frameworks like Apache Spark or Presto, which could drastically improve performance.
- Need for Evolution: As data volume grows, so must the system’s intelligence. Moving towards cloud-native solutions with elastic scaling, parallel processing, and in-memory analytics might be the future roadmap.
Ultimately, the FSCL Analytics project highlights the potential of leveraging data in building smarter cities, while also shedding light on the real-world limitations and challenges of scaling data systems. Whether it’s tracking water usage, optimizing energy consumption, or planning infrastructure investments, data is at the heart of every wise decision. The platform’s continued evolution will be essential in ensuring that insights are delivered at the speed of thought — or faster.
FSCL Analytics Project Technical Summary
The FSCL Raw database “HistData” is transformed into valuable data to analyze daily/monthly/yearly water in and water out data points in the FSCL Analytics database. Used
The technical Skills involved in this project are as follows:
- NET Angular- Web and API
- Microsoft SQL Server 20222 Standard Edition
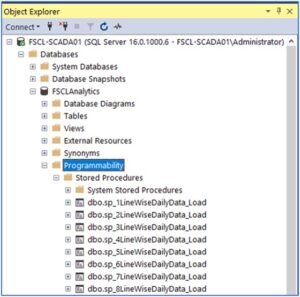
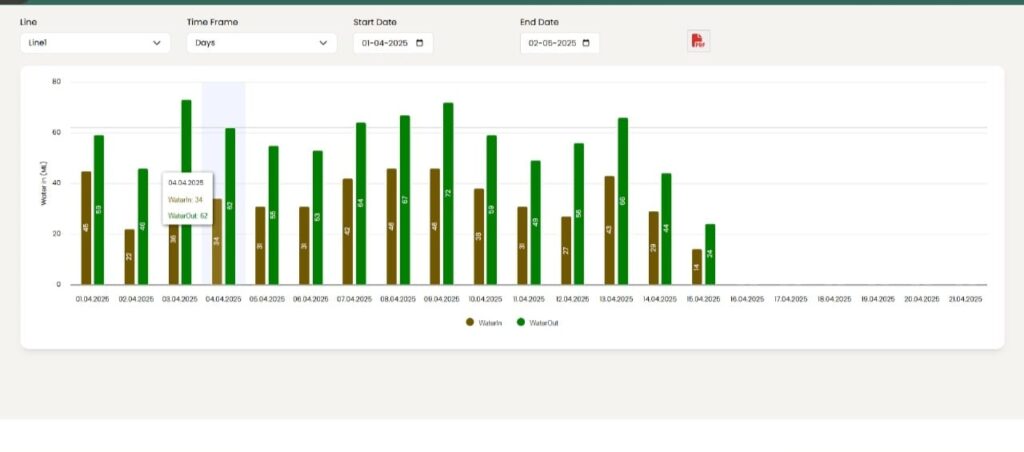
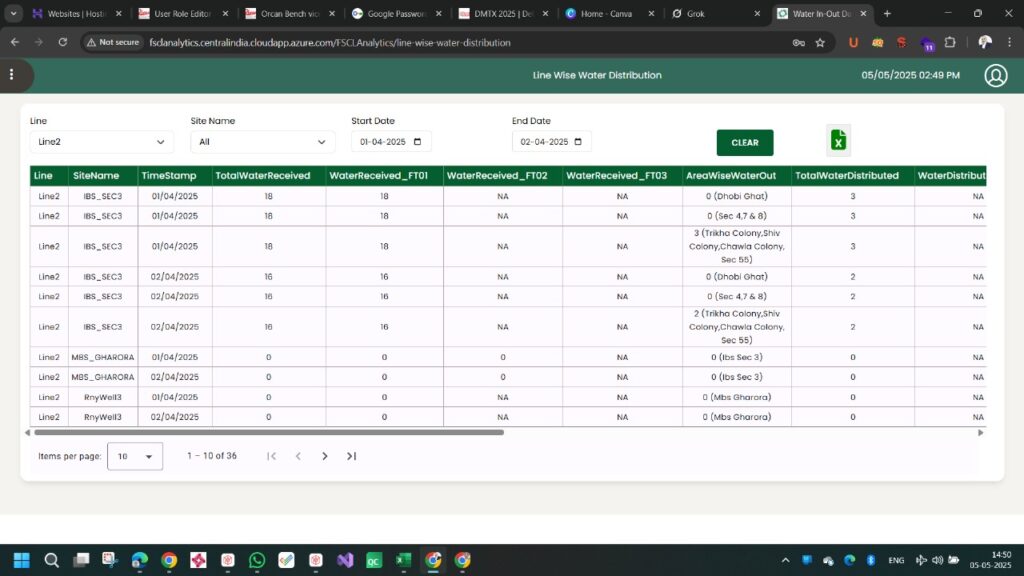
Created SQL Server stored procedure scripts for each line to perform the ETL (Extract Transform Load) to load raw database table records into daily proper analytics records in the form of daily water in and out in ML. Refer to the screenshot below for details on SQL Server stored procedures.
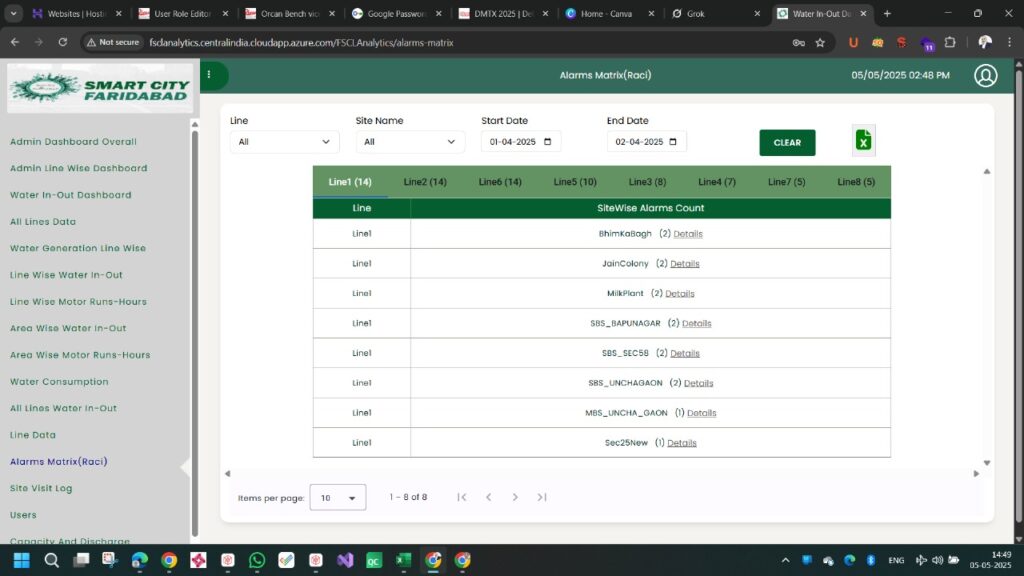
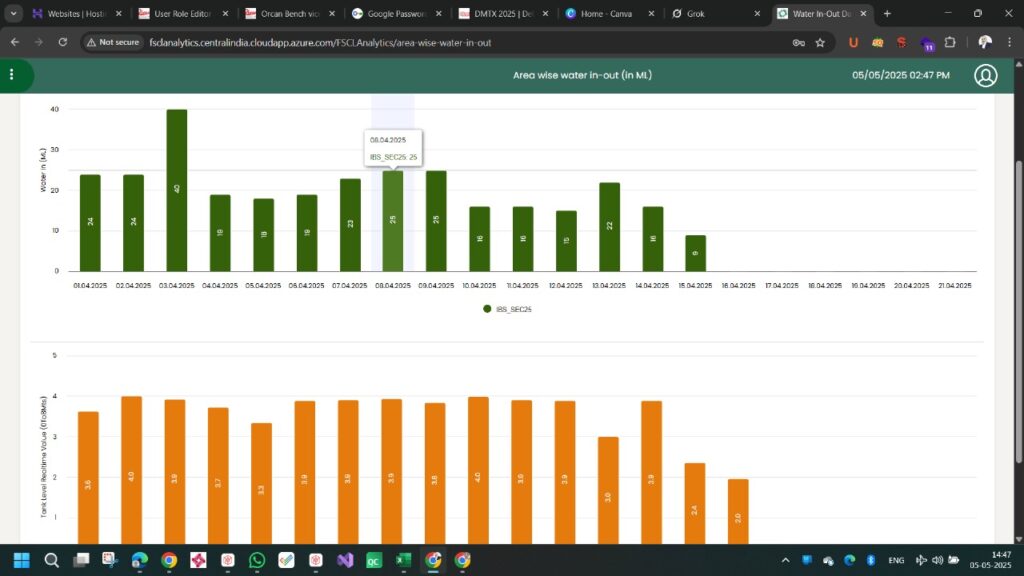
Showing on screen data as per user Credentials
The data aquired from 95 sites has immense importance to analyse the water usage across different localities ,areas etc. all the data set is a master data which is shown to the different level of users with the related data being served.
Like an engineering team would access the electrical and operational data related to energy, motor running hours or other maintenance-related issues. where as the billing department would get the data of water distribution
